Bun / Energy
The slowest framework drew the least power
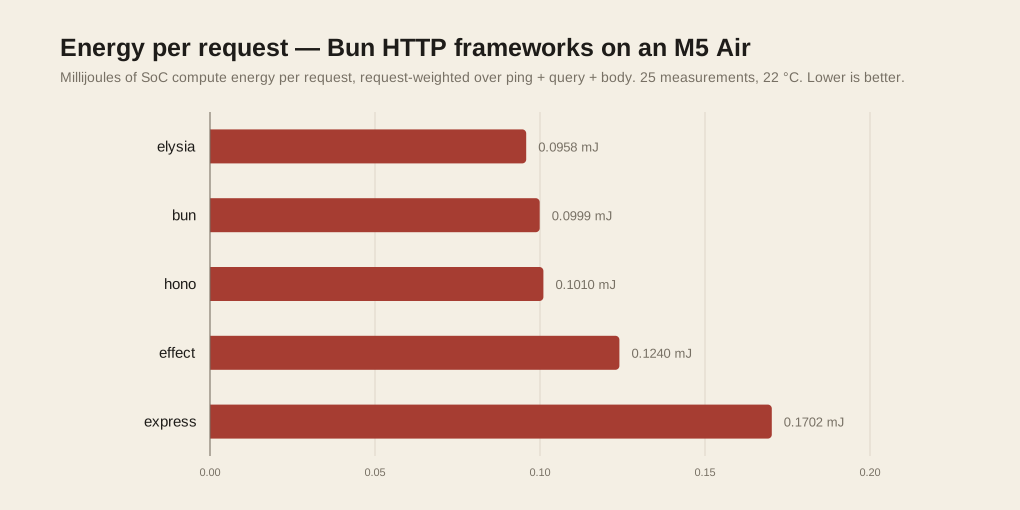
Last time I measured how fast eight Bun HTTP frameworks were on this laptop, and the interesting part turned out to be a mistake I nearly published: benchmarking them back to back made the suite measure the machine’s thermal arc rather than the frameworks.
This time the question is different. Express came out 2.3× slower than Elysia. Is it 2.3× more energy per request? More? Less? Nobody publishes joules-per-request for JavaScript frameworks, and on a fanless laptop — where every watt becomes heat that has nowhere to go — it seemed worth knowing.
The short answer is that it is 1.8×, not 2.3×, and the reason is that Express cannot draw as much power as Elysia. The longer answer is that most of the energy I measured does not belong to the framework at all.
The machine
| Model | MacBook Air (Mac17,3) |
| Chip | Apple M5 — 10 cores, 4 Super + 6 Efficiency |
| Memory | 24 GB unified |
| OS | macOS 26.6.2 (25G83) |
| Bun | 1.4.0 |
| bombardier | 2.0.2 darwin/arm64 |
| Room temperature | 22 °C |
The model above is an Amazon affiliate link — as an Amazon Associate I earn from qualifying purchases, at no extra cost to you.
macOS 26 calls the performance cores “Super” rather than “Performance”, which matters later — it is why my first attempt to read per-cluster frequency returned nothing.
The previous post ran at 25 °C, this one at 22 °C. Throughput numbers here are not comparable to that post. On a passively cooled machine ambient temperature is a parameter, not trivia.
What powermetrics actually measures — and what it leaves out
Everything below comes from powermetrics, sampling at 2 Hz. On Apple Silicon it exposes per-sample energy accumulators in millijoules:
cpu_energy + gpu_energy + ane_energyThat figure is SoC compute energy only. It excludes:
- DRAM. On a unified-memory design this is real, load-dependent, and precisely the part a more allocation-heavy framework would burn more of. This is the most damaging omission for the question I am asking, so it goes first rather than in a footnote.
- SoC fabric, interconnect and the memory controller.
- Display and backlight — frequently the largest single consumer on a laptop.
- SSD, Wi-Fi, Bluetooth, Secure Enclave, always-on domains.
- PMU and VRM conversion losses, and the charger’s own losses.
So every number here is millijoules of SoC compute energy per request, not millijoules at the wall. Wall energy is materially higher. powermetrics says so itself, and the disclaimer is worth quoting because it blesses exactly this use and forbids exactly the overreach:
Average power values reported by powermetrics are estimated and may be inaccurate - hence they should not be used for any comparison between devices, but can be used to help optimize apps for energy efficiency.
Comparing frameworks on one machine: fine. Comparing this machine to yours: not fine.
Method
Five Bun targets — elysia, hono, bun (raw Bun.serve, no framework), effect, express — spanning the full range of the previous post’s results. Five rounds, one measurement each, 25 measurements, four routes per measurement, 10 seconds per route at 500 connections (10 for video).
The ordering problem, again
The previous post established that on this machine a sequential pass decays about 15% from first slot to last. The fix there was randomised order. Here I used a cyclic 5×5 Latin square instead:
      slot1   slot2   slot3   slot4   slot5
R1    elysia  hono    bun     effect  express
R2    hono    bun     effect  express elysia
R3    bun     effect  express elysia  hono
R4    effect  express elysia  hono    bun
R5    express elysia  hono    bun     effect
Every framework occupies every slot exactly once. That is stronger than shuffling: any linear slot effect cancels out of the framework means by construction, so the protection is structural rather than statistical.
I had originally intended simple front-to-back reversal, alternating the order each round. With five frameworks that cannot work — reversing a five-item list leaves the middle item in slot 3 every time, so the one framework you most want to move never moves.
Cooldowns that double as baselines
120 seconds between every measurement, plus a 120-second pre-roll and post-roll: 26 idle windows for free. I integrate the last 60 seconds of each (minus two-second guards at both edges), which skips server teardown, page-cache writeback and the DVFS ramp-down.
This is a warm idle, not a cold one. Silicon leakage rises with temperature, so idle draw an hour in should exceed idle draw at minute five. Subtracting a warm floor is the conservative choice.
Not patching the benchmark
The suite is SaltyAom’s bun-http-framework-benchmark, pinned at 383eddd. Its bench.ts guards its entry point with if (import.meta.main) and exports startServer, waitForStartup, validateServer, ensurePortFree and buildBenchmarkArgs. So my runner imports those and drives the benchmark through upstream’s own code paths without changing a line — git status --porcelain on the clone shows only my untracked energy/ directory.
That is not fastidiousness for its own sake. Because buildBenchmarkArgs is upstream’s own function, the bombardier command line is upstream’s by construction, and the runner asserts it character-for-character before spending 75 minutes. It also means upstream’s main() never runs, which incidentally makes both gotchas from the last post disappear: results/ is never wiped and results.md is never written.
Four deviations I did introduce, all disclosed:
- bombardier gets
-p r -o json— no progress bar, machine-readable output. Strictly less work than upstream’s default. - A fixed 2-second gap between routes, so power windows are cleanly separable. Upstream runs them back to back.
- Frameworks are built once up front, so
Bun.buildenergy is outside every measured window. - The whole job runs under
caffeinate -dimsu. This machine’s AC sleep timer is one minute, and the previous project lost an entire unattended run to exactly that.
Results
Throughput against energy per request
Request-weighted over ping, query and body — video is a different animal and gets its own section:
| Framework | mJ / request | SD | CV | req/s | watts |
|---|---|---|---|---|---|
| elysia | 0.0958 | 0.0006 | 0.6% | 184,915 | 17.69 |
| bun | 0.0999 | 0.0002 | 0.2% | 179,218 | 17.88 |
| hono | 0.1010 | 0.0003 | 0.3% | 176,583 | 17.81 |
| effect | 0.1241 | 0.0004 | 0.3% | 136,690 | 16.93 |
| express | 0.1702 | 0.0011 | 0.6% | 79,668 | 13.54 |
Coefficients of variation of 0.2–0.6% across five rounds, tighter than the 0.5–1.1% of the previous post.
The slow framework draws less power
Mean SoC power under load
This is the result I did not expect. The three fast frameworks all sit within 1% of each other at 17.7–17.9 W. Express draws 13.5 W — 23% less.
Express is 2.32× slower than Elysia, but costs only 1.78× the energy per request, because it cannot keep the cores fed. It is not efficient; it is merely incapable of working the machine as hard. The energy penalty is smaller than the throughput penalty, and that gap is the finding.
By route
Energy per request by route
A note on how that headline number is computed, because the obvious approach is wrong. The video route serves a 14.1 MB file at roughly 850 req/s, against ping’s 185,000. Its millijoules-per-request is about 200× larger, so an unweighted mean across the four routes is essentially the video number wearing a disguise. The previous post’s Average column had this problem. Here the headline is request-weighted across the three small routes, and video is reported separately in its own unit.
Video inverts everything
Video route: energy per megabyte transferred
Four frameworks land within 4% of each other at 1.23–1.28 mJ/MB. Express costs 3.61 mJ/MB — 2.9× worse.
And it is the one route where Express draws more power than anybody else: 17.7 W, against 15.1–15.2 W for the other four, and against its own 12.6–14.3 W on the small routes. On every other route Express is the framework that cannot heat the machine up. On video it is the only one that can.
I do not have an explanation I trust. The previous post also flagged the video column as an open question, and it stays open.
What one window looks like
SoC power across a single 10-second ping window
Where the joules actually went
bombardier runs on the same ten cores as the server it is measuring. So I ran a separate pass with powermetrics’ tasks sampler to find out how much of the energy belongs to the load generator.
I could not compute a per-process joule split, and the failure is more interesting than the number would have been.
I fitted joules = a·P_core_seconds + b·E_core_seconds across the windows. It returns a negative E-core coefficient — which would mean running work on an efficiency core releases energy — with R² of 0.48. The model is wrong, and it is wrong for a physical reason. Compare two windows:
| P-core time | E-core time | energy | |
|---|---|---|---|
| elysia / ping | 51,944 ms | 43,693 ms | 168.5 J |
| express / ping | 27,957 ms | 1,146 ms | 148.3 J |
Elysia accumulates 1.9× the P-core time and 38× the E-core time for 1.14× the energy. At saturation, total SoC power is nearly independent of how much CPU time you pile up — the machine is already near its power ceiling and the cores fill in around it. Energy is simply not proportional to CPU time here, so it cannot be divided up in proportion to CPU time.
What can be measured is the CPU time itself:
Share of CPU time during a 10-second window
For a fast framework, the load generator uses three to four times the CPU of the server it is measuring. On elysia/ping the server accounts for 9% of the window’s CPU time and bombardier takes 42%. Express inverts it — 36% server against 23% bombardier — because it burns so much more CPU per request.
So the honest reading of “0.0958 mJ per request” is: that is what this machine spent per request while benchmarking itself, and the framework under test is a minority of it. It is a valid number for comparing frameworks against each other under identical conditions. It is not the cost of serving a request in production, and it is not 0.0958 mJ of Elysia.
Two caveats on the attribution itself:
- 17–38% of in-window CPU time is unattributable.
DEAD_TASKSis powermetrics’ bucket for processes that exit mid-sample. It correlates with the framework under test rather than being flat background, so I have broken it out explicitly instead of folding it into “other”. Read every share above as a bound, not a point estimate. - powermetrics also offers
--show-process-energy, which is Apple’s Activity Monitor “Energy Impact” — a unitless composite with undocumented weights. It is not joules, and I have not used it to compute any.
Did the Latin square work?
Idle power across the session
Normalising every measurement against its own framework’s mean and correlating that with the slot it ran in gives r = +0.03 across 75 route measurements. Mean normalised energy by slot:
| slot | 1 | 2 | 3 | 4 | 5 |
|---|---|---|---|---|---|
| 1.0000 | 0.9993 | 1.0000 | 1.0003 | 1.0006 |
Flat to within 0.07%. Correlating against absolute session minute instead gives r = −0.018.
One piece of statistical honesty the previous post skipped: with n = 75, the standard error of r is about 0.118, so anything below |r| ≈ 0.23 is consistent with zero, not proven absent. My r = 0.03 clears that comfortably, but “consistent with zero” is the correct claim. The previous post’s r = +0.09 at n = 40 was likewise consistent with zero, not proof.
And the Latin square is doing the heavy lifting structurally, not statistically — a linear slot effect is cancelled by the design itself. The correlation is a check for residual, non-linear drift.
Did it throttle?
No, and this time I can show it rather than assert it.
Idle power went from 26 mW at minute 0 to 21 mW at minute 69, with a fitted slope of +0.0002 W/hour. Flat. thermal_pressure read Nominal in all 100 measured windows. The S-cluster sat at roughly 4.2 GHz throughout.
That is a genuinely different result from the previous post, where throughput decayed 15% across a single sequential pass. The difference is the 120-second cooldowns: 25 measurements of 10-second bursts separated by two minutes of idle never build up the thermal load that five continuous minutes does.
One methodological note for anyone repeating this. I had planned to use --show-plimits to read the CPU speed limit directly. It adds no keys to plist output on macOS 26.6.2 — it only affects the human-readable text format. There is no speed-limit or forced-idle field to parse. The throttling evidence here is per-cluster frequency, thermal_pressure, and the idle-drift curve above.
And as before, pmset -g therm reported nothing whatsoever, start to finish. On this machine it remains useless as a throttling signal.
The measurement problem nobody warns you about
The single largest error I found had nothing to do with thermals.
powermetrics’ timestamp field has one-second resolution. Consecutive samples share a timestamp, then jump 1000 ms, while elapsed_ns in the same sample is precise to a fraction of a millisecond. If you align 10-second load windows against that one-second clock — the obvious thing to do — you can put up to a second of the wrong power into every window.
Fixing it moved mean watts by about 4% and took window coverage from 1.009 to exactly 1.000. The fix is to rebuild a precise time axis from the cumulative elapsed_ns and anchor it to the coarse timestamps by least squares, adding 500 ms to undo the truncation bias.
Two smaller ones, in case they save somebody an afternoon:
- macOS 26 names the performance cluster
S-Cluster(“Super”), notP-Cluster. Code looking forPsilently finds nothing. - bombardier emits percentiles for
rpsbut not forlatency— latency percentiles need-l, which upstream does not pass.
What I would caution against
- This is one machine, one room, one afternoon. 25 measurements pin down the run-to-run noise on this laptop and say nothing about another M5 or a machine with a fan.
- The load generator is inside every number, and for the fast frameworks it is the majority of the CPU time. See the attribution section.
- Energy is SoC compute only. No DRAM, no display, no SSD, nothing at the wall.
- For the fast four, this is close to a restatement of throughput. Their watts sit within 1% of each other, so mJ/request ≈ watts ÷ rps with watts nearly constant; regressing the two gives r² = 0.971. The genuinely independent information lives in Express and in the video column, not across the fast cluster.
- Three of the five are pre-release — Elysia 2.0.0-beta.4, Effect 4.0.0-beta.102 — and these numbers are a snapshot of moving targets.
- Benchmark handlers are empty. The moment a handler awaits a database, all of this shrinks toward irrelevance next to the query.
- The sampler costs something. Running powermetrics at 2 Hz cost roughly 1.5–2.7% throughput in an A/B against uninstrumented runs. It is identical for every framework so it cancels in comparisons, but the absolute figures are slightly inflated.
I should also repeat the disclosure from last time: I have contributed to Elysia’s documentation, and Elysia comes first in this table too.
Reproducing it
git clone https://github.com/saltyaom/bun-http-framework-benchmark
cd bun-http-framework-benchmark
git checkout 383eddd
bun install
Then, in one terminal:
sudo powermetrics -i 500 -n 12000 -s cpu_power,thermal \
  -a 0 -f plist -b 0 -o "$OUT/power.plist" --handle-invalid-values
and the runner in another, under caffeinate. A finite -n matters: it lets the sampler stop on its own, where sudo kill would need a second password once the five-minute sudo timestamp expires.
The runner, the analyzer and the full 112 KB dataset — every one of the 25 measurements, all 26 idle windows, the rejected regression — are in the repo. If you disagree with how I weighted the routes or subtracted idle, the raw numbers are all there.
The thing I would most like someone to check is the video column. Express costs 2.9× the energy per megabyte of everything else and is the only framework that draws more power on that route than on any other. I have no account of why, and one machine is not enough to find out.