Bun / Benchmark
Benchmarking Bun HTTP frameworks on a MacBook Air M5
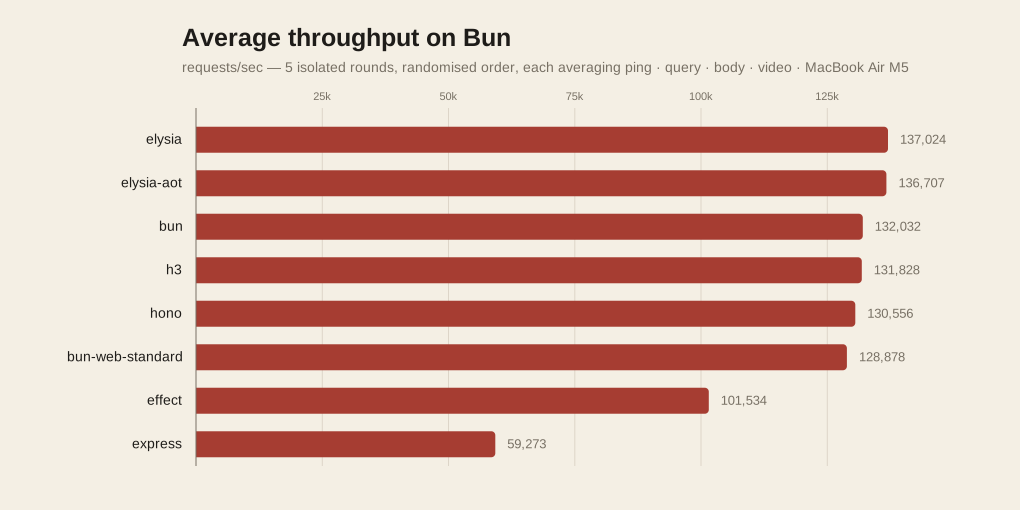
SaltyAom’s bun-http-framework-benchmark publishes its results from a desktop: an Intel Core i7-13700K with 32 GB of DDR5, running Linux. I don’t have that machine. I have a MacBook Air — fanless, ARM, 10 cores, the laptop I actually write code on.
So the question I wanted answered was not “which framework is fastest.” That’s already published, and one more table confirming it isn’t worth anyone’s time. The question was: how much of a desktop’s throughput does a passively-cooled laptop actually give up? I assumed the answer was a flat percentage. It isn’t.
Everything below is the mean of five measurements per framework, each taken in its own process, with the measurement order reshuffled between rounds. That sounds like over-engineering for a laptop benchmark. It is not: the obvious way to run this suite measures the machine’s thermal state about as much as it measures the frameworks, and I only found that out because a result looked too tidy. That detour is the most useful thing in this post, so it comes first.
The machine
| Model | MacBook Air (Mac17,3) |
| Chip | Apple M5 — 10 cores, 4 performance + 6 efficiency |
| Memory | 24 GB unified |
| OS | macOS 26.6.2 (25G83) |
| Bun | 1.4.0 |
| bombardier | 2.0.2 darwin/arm64 |
| Room temperature | 25 °C |
The model above is an Amazon affiliate link — as an Amazon Associate I earn from qualifying purchases, at no extra cost to you.
Run on AC power with the editor and dev server shut down, and pmset -g therm reporting no thermal or performance warnings before or after any run.
I’m listing the ambient temperature because on a fanless machine it’s a real parameter, not trivia. This laptop has no fan to compensate for a warm room — its only options are to soak heat into the chassis and then throttle. It throttles, and working out how much turned into the most interesting part of this exercise. Run the same suite in a 32 °C room and I would not expect these numbers to hold.
What the benchmark actually measures
Four routes, each hit by bombardier --fasthttp for 10 seconds at 500 concurrent connections — except the last, which has its own reason to be different:
- Ping —
GET /returnsHiastext/plain. The floor: how cheap is one request/response cycle. - Query —
GET /id/1?name=bunreturns1 bun. A path parameter and a query parameter, both extracted dynamically — the suite explicitly forbids hardcoded string indexing, so this measures the router and the query parser doing real work. - Body —
POST /jsonreceives{"hello":"world"}, parses it to JSON, and serializes it back. Not an echo of bytes; a genuine round trip through the parser. - Video —
GET /videostreams a 14.1 MB MP4. This one runs at 10 connections instead of 500, and sendsCache-Control: no-storewith a deliberately non-matchingIf-None-Match, so the server can’t shortcut with a 304. Every request moves the whole file.
Each framework also registers about twenty extra background routes that are never requested, so the router has a realistic table to search rather than a trivial one.
Before any load test, the harness boots the server and asserts every response body and header. A framework that returns the wrong thing doesn’t get a number — it gets an error.
Why Bun only
The upstream suite covers Bun, Node, and Deno. I ran only the Bun targets, because Bun is what I actually use. Node and Deno aren’t installed on this machine and I had no reason to install them for this — “Bun versus Node” is a different question, and the upstream README already answers it. What I wanted was the comparison within Bun, on my hardware.
There’s a trap here worth flagging for anyone repeating this on a Bun-only machine, though. I expected the Node targets to fail cleanly, and the Deno ones did — Executable not found in $PATH: "deno". But most of the Node targets started anyway, because Bun transparently shims node for spawned child processes. Left alone, the run would have produced a full table of plausible-looking numbers labelled node that were really Bun executing a Node-targeted bundle.
That’s a good feature and a terrible benchmark result. So: eight Bun targets, explicitly named.
bun/elysia  bun/elysia-aot  bun/hono  bun/bun
bun/bun-web-standard  bun/h3  bun/effect  bun/express
bun/fastify exists in the source tree but sits on the upstream blacklist, so it stays out.
The obvious thing to do is hand that whole list to the runner in one go. Don’t. Why not turned out to be the most interesting thing I learned here.
Versions under test
A benchmark without version numbers has a shelf life of about a week, so:
| Target | Package | Version |
|---|---|---|
| elysia | elysia |
2.0.0-beta.4 |
| elysia-aot | elysia via elysia/plugin/aot/bun |
2.0.0-beta.4 |
| hono | hono |
4.13.1 |
| bun | Bun.serve — no framework |
Bun 1.4.0 |
| bun-web-standard | Bun.serve, Web-standard handler |
Bun 1.4.0 |
| h3 | h3 |
2.0.1-rc.26 |
| effect | effect + @effect/platform-bun |
4.0.0-beta.102 |
| express | express |
5.2.1 |
Worth noticing before you read anything into the ordering: three of the eight are pre-release — Elysia is on a beta, h3 on a release candidate, Effect on a beta. elysia-aot is not a separate package; it’s the same Elysia build run through an ahead-of-time compile plugin, which is why the two rows track each other so closely. Both bun entries are the runtime itself rather than a dependency, so they version with Bun.
Numbers from pre-release software are a snapshot of a moving target. Elysia 2.0 in particular could look different by the time it ships.
The benchmark was measuring my laptop, not the frameworks
The upstream runner takes a list of targets and benchmarks them one after another inside a single process. Eight frameworks, four routes each, about five and a half minutes end to end. My first pass produced exactly what you would hope for: a clean, confident, precisely ordered table. Elysia first, express last, everything neatly spaced in between.
I nearly published it. What stopped me was a nagging question about the shape of the thing — on a fanless laptop, a five-minute sustained load has a thermal arc, and the frameworks measured at the end of that arc are not being measured under the same conditions as the ones at the start.
So I re-ran one pass with the target list reversed. Same machine, same cooldown, same ambient temperature. The only thing that changed was the order.
| Framework | position (fwd → rev) | forward | reversed | change |
|---|---|---|---|---|
| elysia | 1 → 8 | 138,045 | 117,395 | −15.0% |
| elysia-aot | 2 → 7 | 133,837 | 117,188 | −12.4% |
| hono | 3 → 6 | 125,960 | 115,337 | −8.4% |
| bun | 4 → 5 | 125,108 | 120,675 | −3.5% |
| bun-web-standard | 5 → 4 | 120,905 | 120,195 | −0.6% |
| h3 | 6 → 3 | 119,983 | 124,680 | +3.9% |
| effect | 7 → 2 | 92,226 | 97,571 | +5.8% |
| express | 8 → 1 | 55,080 | 59,650 | +8.3% |
The change is monotonic in how far each framework moved. Everything that shifted later got slower, everything that shifted earlier got faster, and the size of the shift tracks the size of the move. Throughput decays about 15% from the first slot to the last within one pass.
In the reversed pass, Elysia scored 117,395 and h3 scored 124,680 — Elysia lost. That is the opposite of the result I was about to publish, produced by changing nothing except the order of a command-line argument list.
pmset -g therm reported no thermal or performance warnings during any of this. On this
machine that check tells you nothing useful, and I had been treating its silence as evidence.
What survives regardless of order: express is last and effect second-to-last in every configuration I ran, by margins nothing else comes close to. It is the fast cluster — everything between roughly 115k and 138k — where position swamps the real difference between frameworks.
The fix
Measure each framework in its own invocation, on an equally cooled machine, and reshuffle the order every round so that whatever drift remains becomes noise instead of a systematic bias in favour of whoever went first.
That means one process per measurement, a 75-second cooldown between every slot, and five
rounds with an independently seeded shuffle each time. Forty measurements, about 77 minutes of
machine time, against five and a half minutes for the naive version. The whole job runs under
caffeinate -dimsu — an earlier unattended attempt was silently destroyed when the Mac went
to sleep partway through and every subsequent measurement came back about 39% low.
Everything below comes from that.
Results
Requests per second, averaged across the four routes, then averaged across five isolated rounds.
| Framework | Average | Ping | Query | Body | Video | Bundle | Startup | Memory after |
|---|---|---|---|---|---|---|---|---|
| elysia | 137,024 | 200,017 | 179,739 | 167,496 | 844 | 171.4 KB | 11.5 ms | 56 MB |
| elysia-aot | 136,707 | 198,962 | 179,868 | 167,152 | 847 | 127.5 KB | 10.7 ms | 54 MB |
| bun | 132,032 | 180,761 | 181,294 | 165,230 | 841 | 2.3 KB | 6.2 ms | 52 MB |
| h3 | 131,828 | 187,835 | 174,552 | 164,080 | 843 | 22.5 KB | 7.9 ms | 60 MB |
| hono | 130,556 | 189,171 | 171,382 | 160,827 | 846 | 20.4 KB | 8.2 ms | 56 MB |
| bun-web-standard | 128,878 | 180,285 | 167,522 | 166,862 | 843 | 1.7 KB | 6.2 ms | 51 MB |
| effect | 101,534 | 157,972 | 138,202 | 109,140 | 823 | 263.2 KB | 27.2 ms | 82 MB |
| express | 59,273 | 90,901 | 76,993 | 68,861 | 338 | 822.8 KB | 29.8 ms | 208 MB |
It is worth putting these next to the sequential numbers I nearly published, because the correction is not uniform — it is a near-perfect function of where each framework sat in the old running order:
| Framework | old slot | sequential mean | isolated mean | change |
|---|---|---|---|---|
| elysia | 1 | 136,966 | 137,024 | +0.0% |
| elysia-aot | 2 | 131,288 | 136,707 | +4.1% |
| hono | 3 | 121,215 | 130,556 | +7.7% |
| bun | 4 | 123,131 | 132,032 | +7.2% |
| bun-web-standard | 5 | 119,195 | 128,878 | +8.1% |
| h3 | 6 | 121,272 | 131,828 | +8.7% |
| effect | 7 | 91,875 | 101,534 | +10.5% |
| express | 8 | 55,156 | 59,273 | +7.5% |
Elysia’s number did not move, because Elysia was always measured first. Every other framework was being charged for heat it did not generate, in rough proportion to how long it had to wait its turn. Express is the one loose end — it gains less than its slot predicts, and I don’t have an explanation I trust.
These isolated rounds also ran in a 25 °C room against 22 °C for the sequential ones. A warmer room should push throughput down, so the true size of the positional bias is if anything slightly larger than this table shows.
How much do these numbers move?
| Framework | Mean | Std dev | CV | Min | Max |
|---|---|---|---|---|---|
| elysia | 137,024 | 965 | 0.7% | 136,121 | 138,156 |
| elysia-aot | 136,707 | 806 | 0.6% | 135,864 | 137,839 |
| bun | 132,032 | 1,059 | 0.8% | 131,028 | 133,689 |
| h3 | 131,828 | 716 | 0.5% | 130,981 | 132,959 |
| hono | 130,556 | 612 | 0.5% | 129,933 | 131,575 |
| bun-web-standard | 128,878 | 776 | 0.6% | 127,954 | 129,699 |
| effect | 101,534 | 507 | 0.5% | 100,886 | 102,236 |
| express | 59,273 | 645 | 1.1% | 58,219 | 59,860 |
Before reading anything into the ordering, the check that matters: did the randomization actually remove the position bias? Normalising every measurement against its own framework’s mean and correlating that against the slot it was measured in gives r = +0.09. Mean normalised throughput by slot:
| slot | 1 | 2 | 3 | 4 | 5 | 6 | 7 | 8 |
|---|---|---|---|---|---|---|---|---|
| 99.9% | 100.0% | 100.1% | 100.1% | 99.9% | 99.5% | 99.9% | 100.6% |
Flat, within a percentage point across the whole round. Compare that to the sequential runner, where slot 8 came in about 15% below slot 1. The isolation works.
With that established, here is what the table will and will not support:
- Elysia and elysia-aot are a tie. They are 317 req/s apart on a base of 137,000, well inside a single standard deviation. The AOT plugin is not measurably faster here; it does cut the bundle from 171.4 KB to 127.5 KB, which may matter more.
bunand h3 are a tie, 204 req/s apart. No ordering between them.- hono sits just below both, by about 1,300 req/s — roughly two standard deviations. Real, but barely.
- bun-web-standard is genuinely last of the fast six, about 2.4% behind
bun. - effect and express are seventh and eighth in every round, and it is not close.
The whole fast cluster spans 6.3%, from 128,878 to 137,024. That is a much tighter spread than the sequential run suggested, because most of what looked like separation between these six was the thermal arc.
The takeaway I would stand behind: bun in this table is Bun.serve with no framework at all
— hand-written routing, hand-written query parsing. Two frameworks beat it, two more are within
1.5% of it, and the slowest of the six is 2.4% behind. The routing abstraction is free.
I should disclose that I’ve contributed to Elysia’s documentation, so take my enthusiasm about the top row with appropriate salt. It’s also not a surprising result — Elysia generates its route handlers ahead of time, which is exactly what this kind of benchmark rewards. What it does not tell you is how a real application behaves once handlers touch a database, and at that point the spread across the top six is noise next to your query planner.
The bottom of the table deserves its own look. Express is 2.3× slower than Elysia and carries a 822.8 KB bundle with 208 MB of RSS after load, against Elysia’s 56 MB. If you’re moving an Express app onto Bun and expecting the runtime to fix your throughput: the runtime helps, but the framework is what’s costing you.
The desktop comparison
This is the part I actually ran the benchmark for. My isolated means against the upstream README’s numbers from the i7-13700K desktop:
| Framework | M5 Air | i7-13700K | M5 as % of desktop |
|---|---|---|---|
| elysia | 137,024 | 209,850 | 65% |
| elysia-aot | 136,707 | 209,333 | 65% |
| bun | 132,032 | 163,149 | 81% |
| hono | 130,556 | 160,703 | 81% |
| bun-web-standard | 128,878 | 148,887 | 87% |
| h3 | 131,828 | 150,884 | 87% |
| express | 59,273 | 56,130 | 106% |
| effect | 101,534 | 90,077 | 113% |
The laptop is not uniformly slower. It gives up about a third of the desktop’s throughput on the fastest frameworks, and it is faster than the desktop on effect and express. That spread — 65% to 113% — is more than a hundred times the run-to-run noise.
I want to flag that this conclusion survived the methodology change, because it easily might not have. The confounded numbers said 63%–102%; the clean ones say 65%–113%. The shape is the same and the effect is slightly stronger, but I only know that because I recomputed it rather than assuming.
The ordering is the opposite of intuition, and it makes sense once you look at where the time goes. When the framework is thin, most of the work per request is the HTTP stack — syscalls, loopback, connection handling — and that’s where the desktop’s clock speed and memory subsystem win, while my load generator is simultaneously fighting the server under test for the same 10 cores. When the framework is heavy, time per request is dominated by JavaScript execution inside the handler, and M5 single-core is simply competitive with a 13700K there.
Put bluntly: the faster your framework, the more your hardware matters. Express is slow enough that it hides the difference between a laptop and a desktop entirely.
The video column is the exception to my own explanation, and I’d rather flag it than tidy it away. Six of the eight targets score 1,530–1,735 req/s upstream against my 823–847 — the laptop gives up about half, a much wider gap than any other route. The other two go the opposite way: upstream’s h3 manages only 272 req/s on video where mine averages 843, and express is 263 against my 338. I can’t explain either direction from these runs, so treat the whole video column as an open question rather than a finding.
What I’d caution against
- This is one machine. Five rounds pin down the run-to-run noise on this laptop; they say nothing about how another M5, or a machine with a fan, would behave.
- The load generator shares the machine with the server. bombardier and the framework are competing for the same 10 cores. This compresses everything, and it compresses the fast frameworks hardest — which is part of why my desktop-versus-laptop ratios are not clean hardware ratios.
- It’s a laptop running a desktop OS. Spotlight, Time Machine, and whatever else macOS decided to do during those ten seconds are all in the numbers. That is most of what the ±1% is.
- Thermals are handled, not eliminated. Isolating each measurement and randomising the
order decorrelates thermal drift from framework identity — it does not make the laptop stop
throttling. A framework measured on a warm machine is still slower; it is just no longer
systematically the same frameworks getting the warm machine. And do not trust
pmset -g thermto tell you when this is happening. It stayed silent through a 15% decay. - Benchmark handlers are empty. Every route here returns immediately. The moment a handler awaits a database, these differences shrink toward irrelevance.
Reproducing it
git clone https://github.com/saltyaom/bun-http-framework-benchmark
cd bun-http-framework-benchmark
bun install
bun run verify   # boots every framework and checks the routes
Then measure one framework at a time, rather than handing the runner all eight:
caffeinate -dimsu bun bench.ts bun/elysiaCool down for 75 seconds, do the next one, and reshuffle the order on every round. My runner script is thirty lines of zsh around that loop. Three things that cost me time:
The runner deletes the entire results/ directory at the start of every invocation. With
one framework per invocation, that means you must copy each result out before starting the
next, or you will have exactly one row at the end.
results/results.md has no trailing newline, so appending rows with >> concatenates them
onto a single line. printf '%s\n' "$(sed -n '3p' results/results.md)" fixes it.
Wrap the whole job in caffeinate -dimsu. An unattended run will otherwise sleep, and the
measurements after it wakes come back about 39% low — consistently enough to look like real
data rather than an error.
And check your ordering assumption before you publish. A single sequential pass of this suite produces a clean, confident, precisely ordered table, and on a fanless machine a good part of that ordering is a thermal artefact. I would not have known that from one pass. I’d have published it.
The upstream README says it best: run this on your own machine, because performance varies between machines. That turned out to be true in a more interesting way than I expected — it also varies within a machine, depending on what you measured five minutes earlier.