Elysia / Hono
Elysia vs Hono with PostgreSQL on a MacBook Air M5
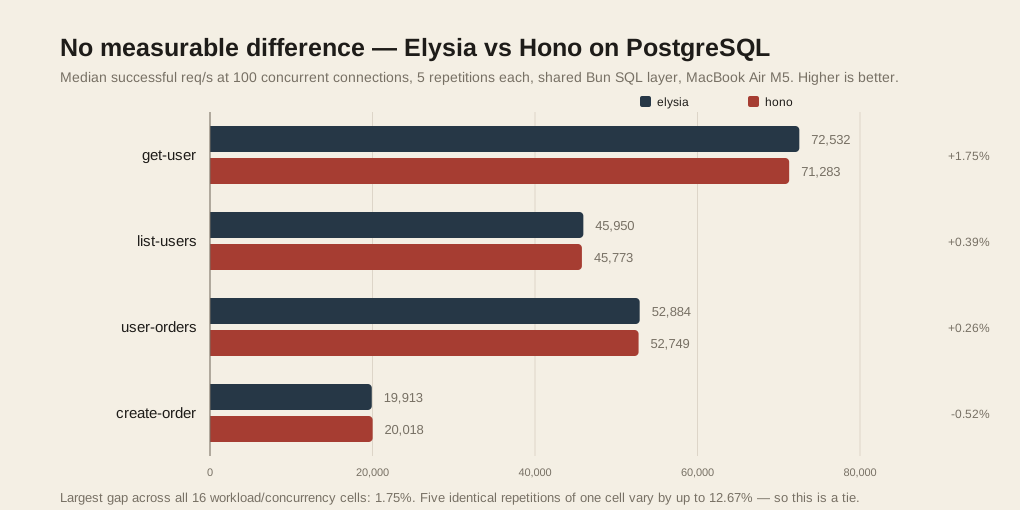
This experiment compares Elysia and Hono using the same PostgreSQL database functions and Bun SQL client, without an ORM. The load generator, API and database run as separate processes on one Mac over localhost, with only one framework active at a time. These are local end-to-end results, not isolated router throughput.
Method
The baseline contains 100,000 users, 1,000,000 orders and 3,000,000 order_items, generated by a counter-based MD5 generator with seed 424242. It uses BIGSERIAL keys, foreign keys and indexes on orders(user_id), orders(user_id, created_at DESC), order_items(order_id) and users(created_at DESC, id DESC). Seeding is followed by ANALYZE; PostgreSQL is not performance-tuned.
Four workloads run separately: user 42424 lookup, latest 20 users, user 42424 with up to 20 orders, and a transaction inserting an order with three items. The selected user has 12 baseline orders. Requests reuse fixed inputs: these are hot-key, warm-cache workloads, not random production traffic.
Full uses concurrency 1, 10, 50 and 100, with five repetitions per framework: 160 trials. Frameworks run in adjacent pairs with deterministic, alternating first positions. Each trial resets/reseeds, starts the API, warms up for exactly 1,000 requests, settles for five seconds, measures for 30 seconds, stops the API and cools down for 15 seconds. Bombardier uses closed-loop HTTP/1 keep-alive with a ten-second request timeout.
Both frameworks use the same ten-connection pool, SQL, validation and JSON serialization. Elysia uses its native listen adapter; Hono uses Bun.serve. Both run in production mode without access logging or caching middleware.
All 160 trials ran on one MacBook Air (Mac17,3) — Apple M5, 10 cores, 24 GB unified memory — on AC power throughout. The exact Bun, PostgreSQL, Elysia, Hono and Bombardier versions below are read back from the machine at run time, not typed in by hand.
The model above is an Amazon affiliate link — as an Amazon Associate I earn from qualifying purchases, at no extra cost to you.
Recorded environment
Session: 2026-09-12T14-24-22-067Z-full-4423a21a
2026-09-12T14:24:22.067Z — 2026-09-12T17:03:10.238Z
| Item | Recorded value |
|---|---|
| macOS | ProductName: macOS ProductVersion: 26.6.2 BuildVersion: 25G83 |
| CPU / RAM | Apple M5 / 24 GiB |
| Bun / PostgreSQL | 1.4.0 / 18.6 |
| Elysia / Hono | 1.4.30 / 4.13.7 |
| Bombardier | 2.0.2 |
| Homebrew formula | postgresql@18 18.6 |
PostgreSQL configuration
| Setting | Value | Unit |
|---|---|---|
autovacuum | on | — |
checkpoint_completion_target | 0.9 | — |
checkpoint_timeout | 300 | s |
effective_cache_size | 524288 | 8kB |
fsync | on | — |
full_page_writes | on | — |
jit | on | — |
listen_addresses | localhost | — |
maintenance_work_mem | 65536 | kB |
max_connections | 100 | — |
max_parallel_workers_per_gather | 2 | — |
max_wal_size | 1024 | MB |
min_wal_size | 80 | MB |
port | 5432 | — |
random_page_cost | 4 | — |
seq_page_cost | 1 | — |
server_version | 18.6 (Homebrew) | — |
shared_buffers | 16384 | 8kB |
synchronous_commit | on | — |
wal_level | replica | — |
work_mem | 4096 | kB |
Successful throughput
Five repetitions per point; all runs contribute. The line-chart vertical axes do not necessarily begin at zero; compare the exact table values.
get-user
| c | Framework | Median req/s | Min–max req/s | Mean ms¹ | p50 ms¹ | p95 ms¹ | p99 ms¹ | Max ms |
|---|---|---|---|---|---|---|---|---|
| 1 | elysia | 18,116.69 | 17,904.51–18,156.69 | 0.05 | 0.05 | 0.06 | 0.07 | 1.19 |
| 1 | hono | 18,072.89 | 17,854.94–18,078.03 | 0.05 | 0.05 | 0.06 | 0.07 | 1.15 |
| 10 | elysia | 59,488.29 | 58,539.61–59,962.34 | 0.17 | 0.16 | 0.23 | 0.42 | 14.46 |
| 10 | hono | 59,063.29 | 57,972.6–59,881.68 | 0.17 | 0.16 | 0.23 | 0.41 | 7.47 |
| 50 | elysia | 69,802.47 | 68,458.74–70,324.56 | 0.71 | 0.67 | 1.16 | 1.4 | 10.28 |
| 50 | hono | 69,065.91 | 67,742.16–69,686.02 | 0.72 | 0.68 | 1.16 | 1.39 | 9.91 |
| 100 | elysia | 72,531.63 | 70,665.31–72,922.91 | 1.38 | 1.3 | 2.1 | 2.49 | 9.09 |
| 100 | hono | 71,282.64 | 69,633.05–71,636.7 | 1.4 | 1.33 | 2.12 | 2.49 | 8.78 |
list-users
| c | Framework | Median req/s | Min–max req/s | Mean ms¹ | p50 ms¹ | p95 ms¹ | p99 ms¹ | Max ms |
|---|---|---|---|---|---|---|---|---|
| 1 | elysia | 12,946.76 | 12,859.88–13,039.77 | 0.08 | 0.08 | 0.08 | 0.09 | 1.17 |
| 1 | hono | 12,902.49 | 12,649.06–13,033.39 | 0.08 | 0.08 | 0.08 | 0.09 | 1.1 |
| 10 | elysia | 39,839.62 | 39,085.66–39,958.8 | 0.25 | 0.24 | 0.34 | 0.58 | 7.1 |
| 10 | hono | 39,819.01 | 38,995.98–40,070.06 | 0.25 | 0.24 | 0.34 | 0.55 | 4.82 |
| 50 | elysia | 44,620.14 | 43,576.32–45,283.24 | 1.12 | 1.06 | 1.75 | 2.1 | 12.47 |
| 50 | hono | 43,995 | 43,034.77–44,385.07 | 1.13 | 1.08 | 1.76 | 2.12 | 20.12 |
| 100 | elysia | 45,950.09 | 44,593.55–46,587.26 | 2.17 | 2.11 | 3.15 | 3.69 | 29.07 |
| 100 | hono | 45,773.26 | 44,599.43–46,369.85 | 2.18 | 2.12 | 3.13 | 3.66 | 11.45 |
user-orders
| c | Framework | Median req/s | Min–max req/s | Mean ms¹ | p50 ms¹ | p95 ms¹ | p99 ms¹ | Max ms |
|---|---|---|---|---|---|---|---|---|
| 1 | elysia | 11,151.3 | 11,127.56–11,240.41 | 0.09 | 0.09 | 0.1 | 0.11 | 1.63 |
| 1 | hono | 11,181.5 | 11,099.48–11,257.17 | 0.09 | 0.09 | 0.09 | 0.11 | 1.54 |
| 10 | elysia | 44,112.4 | 42,927.47–44,267.83 | 0.23 | 0.21 | 0.31 | 0.52 | 69.1 |
| 10 | hono | 44,167.55 | 43,060.34–44,204.13 | 0.23 | 0.21 | 0.31 | 0.5 | 7.53 |
| 50 | elysia | 51,425.96 | 49,893.8–51,789.76 | 0.97 | 0.92 | 1.67 | 2.15 | 72.93 |
| 50 | hono | 50,699.66 | 49,607.03–51,327.84 | 0.98 | 0.93 | 1.64 | 2.1 | 82.45 |
| 100 | elysia | 52,884.08 | 51,330.82–53,249.39 | 1.89 | 1.56 | 4.41 | 6.52 | 84.22 |
| 100 | hono | 52,749.22 | 51,372.99–52,992.27 | 1.89 | 1.59 | 4.05 | 6.43 | 115.02 |
create-order
| c | Framework | Median req/s | Min–max req/s | Mean ms¹ | p50 ms¹ | p95 ms¹ | p99 ms¹ | Max ms |
|---|---|---|---|---|---|---|---|---|
| 1 | elysia | 4,725.46 | 4,720.22–4,762.51 | 0.21 | 0.21 | 0.23 | 0.25 | 14.18 |
| 1 | hono | 4,740.17 | 4,714.33–4,748.77 | 0.21 | 0.21 | 0.22 | 0.26 | 37.07 |
| 10 | elysia | 20,458.75 | 19,908.35–20,657.98 | 0.49 | 0.45 | 0.65 | 0.84 | 85.19 |
| 10 | hono | 20,431.79 | 18,172.51–20,760.42 | 0.49 | 0.46 | 0.63 | 0.81 | 77.99 |
| 50 | elysia | 20,241.74 | 19,856.66–20,402.27 | 2.47 | 2.33 | 2.87 | 7.6 | 97.74 |
| 50 | hono | 20,308.72 | 19,887.44–20,520.36 | 2.46 | 2.31 | 2.8 | 8.11 | 87.1 |
| 100 | elysia | 19,912.81 | 19,335.74–20,127.68 | 5.02 | 4.89 | 5.59 | 9.96 | 106.28 |
| 100 | hono | 20,017.78 | 19,689.06–20,268.39 | 4.99 | 4.81 | 5.43 | 9.85 | 87.63 |
¹ Median of per-trial statistics, not a pooled latency distribution. HTTP and transport errors: zero across every included trial. Missing percentiles are N/A.
Resource samples
Median across repetitions. CPU: one fully used core = 100%. RSS: sampled peak in MiB; PostgreSQL totals can count shared pages more than once. These measurements do not prove absence of client saturation.
| Workload | c | Framework | API CPU % | Load CPU % | PG CPU % | API MiB | Load MiB | PG MiB |
|---|---|---|---|---|---|---|---|---|
| create-order | 1 | elysia | 37.73 | 15.86 | 37.55 | 68.77 | 20.31 | 1,284.67 |
| create-order | 1 | hono | 37.56 | 15.96 | 37.69 | 63.86 | 20.25 | 1,281.69 |
| create-order | 10 | elysia | 112.63 | 83.06 | 355.77 | 73.14 | 22.8 | 2,026.41 |
| create-order | 10 | hono | 112.73 | 83.69 | 355.82 | 68.25 | 22.58 | 2,028.14 |
| create-order | 50 | elysia | 111.97 | 92.86 | 354.51 | 77 | 23.44 | 2,028.09 |
| create-order | 50 | hono | 110.85 | 93.39 | 356.21 | 70.17 | 22.94 | 2,031.78 |
| create-order | 100 | elysia | 114.06 | 93.98 | 349.81 | 78.86 | 25.78 | 2,023.48 |
| create-order | 100 | hono | 114.19 | 94.56 | 352.79 | 73.08 | 25.5 | 2,026.8 |
| get-user | 1 | elysia | 53.13 | 77.3 | 20.58 | 62.91 | 40.97 | 806.02 |
| get-user | 1 | hono | 53.16 | 76.54 | 20.48 | 59.84 | 41.03 | 807.53 |
| get-user | 10 | elysia | 113.5 | 227.35 | 197.39 | 66.08 | 23.52 | 834.16 |
| get-user | 10 | hono | 113.01 | 226.08 | 195.58 | 58.81 | 23.58 | 832.09 |
| get-user | 50 | elysia | 108.6 | 336.1 | 191.51 | 70.11 | 24.8 | 915.86 |
| get-user | 50 | hono | 108.06 | 329.75 | 184.99 | 65.72 | 24.7 | 831.31 |
| get-user | 100 | elysia | 109.25 | 332.65 | 183.52 | 71.38 | 27.77 | 908.94 |
| get-user | 100 | hono | 108.17 | 322.34 | 181.08 | 65.88 | 27.89 | 916.75 |
| list-users | 1 | elysia | 50.29 | 59.22 | 27.23 | 64.41 | 40.8 | 819.34 |
| list-users | 1 | hono | 50.06 | 45.12 | 27.3 | 59.02 | 40.34 | 819.59 |
| list-users | 10 | elysia | 112.16 | 149.19 | 228.96 | 69.08 | 23.36 | 838.73 |
| list-users | 10 | hono | 110.98 | 149.49 | 227.62 | 60.91 | 23.53 | 837.92 |
| list-users | 50 | elysia | 115.2 | 202.32 | 215.14 | 80.08 | 24.75 | 910.45 |
| list-users | 50 | hono | 113.48 | 198.95 | 210.74 | 79.11 | 24.78 | 957.23 |
| list-users | 100 | elysia | 118.09 | 190.17 | 207.35 | 81.25 | 27.11 | 837.89 |
| list-users | 100 | hono | 116.23 | 189.73 | 207.52 | 78.78 | 27.28 | 834.69 |
| user-orders | 1 | elysia | 38.91 | 37.37 | 42.22 | 62.17 | 20.86 | 807.55 |
| user-orders | 1 | hono | 39.11 | 37.34 | 41.88 | 60.77 | 20.88 | 807.72 |
| user-orders | 10 | elysia | 114.79 | 161.78 | 391.24 | 66.38 | 23.48 | 948.92 |
| user-orders | 10 | hono | 114.04 | 161.91 | 391.21 | 60.33 | 23.52 | 944.58 |
| user-orders | 50 | elysia | 114.09 | 272.02 | 428.47 | 76.69 | 24.72 | 943.03 |
| user-orders | 50 | hono | 112.36 | 268.56 | 422.59 | 73.58 | 24.45 | 950.05 |
| user-orders | 100 | elysia | 115.07 | 287.08 | 423.59 | 77.44 | 27.7 | 970.06 |
| user-orders | 100 | hono | 114.05 | 285.14 | 421.66 | 73.83 | 27.7 | 952.77 |
Download the evidence
- Summary CSV
- Sanitized numeric raw results, all warm-ups and measurements
- Protocol, versions, source hashes and configuration
What the measurements show
No measurable difference between the two frameworks. Across all sixteen workload/concurrency cells, the largest gap between the Elysia and Hono medians is 1.75% (get-user at concurrency 100: 72,532 against 71,283 successful req/s). The median absolute gap is 0.34%, Elysia is nominally ahead in eleven of sixteen cells, and in no cell do the two frameworks’ five-repetition min–max ranges fail to overlap.
That gap is smaller than this harness’s own repeat noise. Within a single cell, five identical repetitions spread by a median of 2.94% between fastest and slowest, and by 12.67% in the worst case (create-order at concurrency 10). A difference of one or two percent therefore cannot be separated from run-to-run variation here, so this article names no winner.
What the numbers do show is where the ceiling is, and it is not the router. Sampled API CPU flattens near 113% — about 1.1 cores for the single Bun process — from concurrency 10 upward in every workload, while PostgreSQL reaches 180–430% and Bombardier itself takes 149–336% on the read workloads. All three compete for the same ten cores.
The read workloads still gain throughput from concurrency 10 to 100 (get-user 59,488 to 72,532 req/s). The write workload does not: create-order peaks at concurrency 10 with 20,459 req/s and settles slightly lower at 19,913 by concurrency 100, which is consistent with the fixed ten-connection pool plus write amplification rather than with any property of either framework.
Read this as a result about the database path on one machine, not as a framework ranking. Both routers are far from being the constraint at these rates, so the experiment mostly measures PostgreSQL, Bun’s SQL client and the shared pool.
Interpretation and limitations
Tables report the median and min–max across every repetition, not just the fastest trial. Throughput is successful 2xx responses divided by the tool’s recorded elapsed time, including final in-flight drain. Client-observed latency includes pool waiting. Reported percentile medians summarize per-trial percentiles; they are not pooled percentiles over all requests. Missing values are N/A, never substituted with RPS percentiles.
The generator, API and PostgreSQL compete for CPU and thermal headroom. Differences cannot be attributed entirely to framework overhead or generalized to a production ranking. Concurrency above ten can expose the shared pool/database limit; the client can also be the bottleneck. CPU is derived from cumulative CPU-time samples taken approximately once per second. RSS is a sampled peak, and summed PostgreSQL RSS can double-count shared pages.
Cooldown does not prove thermal steady state. This protocol does not measure room temperature or energy. It changes no power mode, CPU affinity, caches or PostgreSQL settings. AC power and a temporary caffeinate idle-sleep assertion are used. Write tables grow with throughput, so final sizes differ despite identical baseline and warm-up counts. Closed-loop traffic can hide queueing compared with a fixed arrival rate.
Only a complete Full session with no HTTP/transport errors is eligible for this article. Quick is a workflow check and is excluded. Earlier HTTP-only articles and SELECT 1 diagnostics are not directly comparable.
Reproduce and inspect the evidence
Run from the benchmark project alongside the blog repository. Execute commands drop and reseed only the project-marked benchmark_db. Keep .env private. Use the recorded Bun, PostgreSQL and Bombardier versions, frozen lockfile and attached source hashes.
bun install --frozen-lockfile
bun run typecheck
bun run test
bun run bench:run --profile quick --execute
bun run bench:run --profile full --execute
# Use the exact Full session directory printed by the runner:
bun run bench:report --session reports/runs/SESSION_ID